In 2019, the animals and animal products’ industry generated the largest sales, approximately R153.1 billion.
This is according to Statistics SA recently published agricultural survey, which compared the Agri sector 2019 performance to 2017.
“Total income earned in the agriculture and related services industry was R351.4 billion in 2019 compared with R314.0 billion in 2017,” said Stats SA.
The year 2019 was particularly a torrid time for the animal industry, mainly because of the outbreak of Foot and Mouth Disease. By December 2019, the department of agriculture, land reform and rural development (DALRRD) and the Foot and Mouth Disease (FMD) Technical Task Team had identified 11 commercial properties that were found to be infected and confirmed positive.
This resulted in Minister Thoko Didiza gazetting a national ban on the gathering of cloned hoofed animals and livestock auctions.
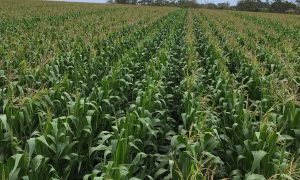
During this period, the Bureau for Food and Agricultural Policy (BFAP) 2019 perspectives on agricultural performance, GDP said that the sector’s quarter 4 gross value of production (GPV) from animal products increased by 10% from 2018 to 2019.
“Cattle (or beef) was the largest contributor increasing by 12%. The number of cattle slaughtered in Q4 2019 increased relative to the same quarter in 2018. Similarly, sheep slaughters increased by 468 964 (10.7%), and pig slaughters by 240 331 (8%). Perspective on agriculture’s performance in Quarter 4 of 2019.”
The Stats SA agricultural survey only covered activities of commercial farms in South Africa who are registered for value added tax (VAT).
“The enterprises are divided into four size groups according to the value of turnover as recorded on Stats SA’s business register (BR). Large enterprises are those with an annual recorded turnover above R30 million,” it highlighted.
Altogether, the survey also found that the total expenditure incurred by the farming sector in 2019 was R330.4 billion compared with R289.1 billion in 2017. This was an annualized increase of 6.9%.
“The highest contributor to total expenditure was ‘purchases’ with 51.7%, followed by ‘salaries and wages’ (13.1%), ‘repairs and maintenance’ (5.3%) and ‘depreciation’ (4.6%).”